Additional Information
Book Details
Abstract
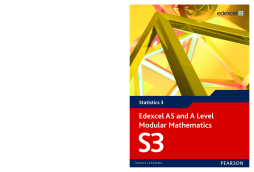
Edexcel's own course for the new GCE specification. Providing the best match to the specification, this book motivates students by making maths easier to learn. Written by chief examiners, it provides student-friendly worked examples and solutions, leading to a wealth of practice questions, and sample past exam papers for thorough exam preparation. Regular review sections help to consolidate learning, and opportunities for stretch and challenge are presented throughout the course. An interactive FREE LiveText CD-ROM contains everything students need to motivate and prepare themselves. The all new Exam Cafe gives students revision advice, key ideas summaries and an abundance of exam practice, with hints and tips.
Table of Contents
| Section Title | Page | Action | Price |
|---|---|---|---|
| Cover | Cover | ||
| Contents | ii | ||
| About this book | iv | ||
| Chapter 1: Combinations of random variables | 1 | ||
| 1.1: Finding the distribution of random variables | 2 | ||
| Chapter 2: Sampling | 7 | ||
| 2.1: Populations and sampling | 8 | ||
| Taking a census | 8 | ||
| Sampling | 8 | ||
| 2.2: Random sampling | 9 | ||
| Sampling with and without replacement | 9 | ||
| 2.3: Simple random sampling | 10 | ||
| Random number sampling | 10 | ||
| Lottery sampling | 12 | ||
| 2.4: Other methods of sampling | 13 | ||
| Systematic sampling | 13 | ||
| Stratified sampling | 14 | ||
| 2.5: Non-random sampling | 15 | ||
| Quota sampling | 16 | ||
| 2.6: Primary and secondary sources of data | 17 | ||
| Chapter 3: Estimation, confidence intervals and tests | 21 | ||
| 3.1: Concept of a statistic and sampling distribution | 22 | ||
| 3.2: Estimation of population parameters using a sample | 27 | ||
| 3.3: Standard error of the mean | 31 | ||
| 3.4: The Central Limit Theorem | 35 | ||
| 3.5: Confidence intervals | 39 | ||
| Interpreting confi dence intervals | 41 | ||
| 3.6: Hypothesis tests | 45 | ||
| 3.7: Hypothesis test for the difference between two means | 50 | ||
| 3.8: Large samples | 54 | ||
| Review Exercise 1 | 63 | ||
| Chapter 4: Goodness of fit and contingency tables | 67 | ||
| 4.1: Forming a hypothesis | 68 | ||
| 4.2: Goodness of fit | 69 | ||
| 4.3: Degrees of freedom | 70 | ||
| 4.4: The chi-squared (_2) family of distributions | 70 | ||
| 4.5: Testing your hypothesis | 71 | ||
| 4.6: The general method for testing the goodness of fit | 73 | ||
| 4.7: Applying goodness-of-fit tests to discrete data | 74 | ||
| Testing a discrete uniform distribution as a model | 74 | ||
| Testing a binomial distribution as a model | 75 | ||
| Testing a Poisson distribution as a model | 79 | ||
| 4.8: Applying goodness-of-fit tests to continuous distributions | 84 | ||
| Testing a normal distribution as a model | 84 | ||
| Testing a continuous uniform distribution as a model | 87 | ||
| 4.9: Contingency tables | 91 | ||
| Setting the hypotheses | 92 | ||
| Selecting a model | 92 | ||
| Degrees of freedom | 92 | ||
| Chapter 5: Regression and correlation | 101 | ||
| 5.1: Spearman’s rank correlation coefficient | 102 | ||
| A quicker way of fi nding Spearman’s rank correlation coefficient | 103 | ||
| 5.2: Testing the hypothesis that a correlation coefficient is zero | 107 | ||
| Product-moment correlation coeffi cient | 107 | ||
| 5.3: Testing the hypothesis that Spearman’s population rank correlation coefficient is zero | 111 | ||
| Review Exercise 2 | 119 | ||
| Examination style paper | 126 | ||
| Appendix | 128 | ||
| The normal distribution function | 129 | ||
| Percentage points of the normal distribution | 130 | ||
| Binomial cumulative distribution function | 131 | ||
| Answers | 140 | ||
| Index | 151 |
